Energetics - Kinetics - Equilibria - Redox - Group VII - Group II - Metal Extraction - Haloalkanes - Alkenes - Alcohols - Analytical Tech... - Unit 1
There are two techniques which you need to be able to talk about at AS,;
Mass Spectroscopy
We already know that a mass spectrometer can be used to find the relative masses of different isotopes of an element, the abundance of the isotopes and the molecular mass of a compound.
And we already know that the peak on the mass spectrum is called a molecular ion peak. (Ion because they are formed by knocking off an electron - ionization - and will not be accelerated, deflected or detected unless they are ionized.)
NEW: Fragmentation
When we bombard large complex organic compounds with electrons sometimes they break down into smaller fragments. This is actually useful to us as it can help us to identify a molecule and even determine the structure of an unknown compound.
Example
Propane will form the molecular ion;
CH3CH2CH3+
and will break down into;
CH3CH2● + CH3+
or;
CH3CH2+; + CH3●
CH3CH2CH3+
and will break down into;
CH3CH2● + CH3+
or;
CH3CH2+; + CH3●
On the mass spectrum we would then see the molecular ion peaks for each of the positive ions formed, these being at 44 for the propane ion, 29 for the ethyl ion, and 15 for the methyl ion.
Method
You will know the molecular mass by the heaviest peak. eg for propane this will be at 44.
First identify the molecular ions in the spectra by looking at the major peaks (minor peaks may appear after these due to the presence of C-13 in some molecular ions.
This should help you to identify the functional groups (eg, C=O) if present. With other fragments you add the mass of carbon (12), oxygen (1), and oxygen (16) until you come up with a sensible combination.
Table of common molecular ions - not given in exam
| CH3+ | 15 |
| CH2CH3+ | 29 |
| CH2CH2CH3+ | 43 |
| OH+ | 17 |
| COCHs+ | 43 |
| C=O+ | 28 |
Practice Exam questions
1. Write down all the possible fragment ions of propan-1-ol.
2. Write down all the possible fragment ions of ethanol.
3. A mass spectrum has peaks at 15,17, 28,29,43,44,60,61(minor), it is a carboxylic acid what is it's structure?
2. Write down all the possible fragment ions of ethanol.
3. A mass spectrum has peaks at 15,17, 28,29,43,44,60,61(minor), it is a carboxylic acid what is it's structure?
Infrared Spectroscopy
In Infrared (IR) spectroscopy, we pass a small beam of IR radiation through a sample.
When the IR hits the sample different frequencies of the IR radiation are absorbed by different bonds in the sample. (Different atoms also absorb different frequencies but in organic chemistry this isn't very useful because they all contain C, H and O atoms).
If the one is in different places they will also absorb differently e.g. the OH bond in an atom and the OH bond in a carboxylic acid.
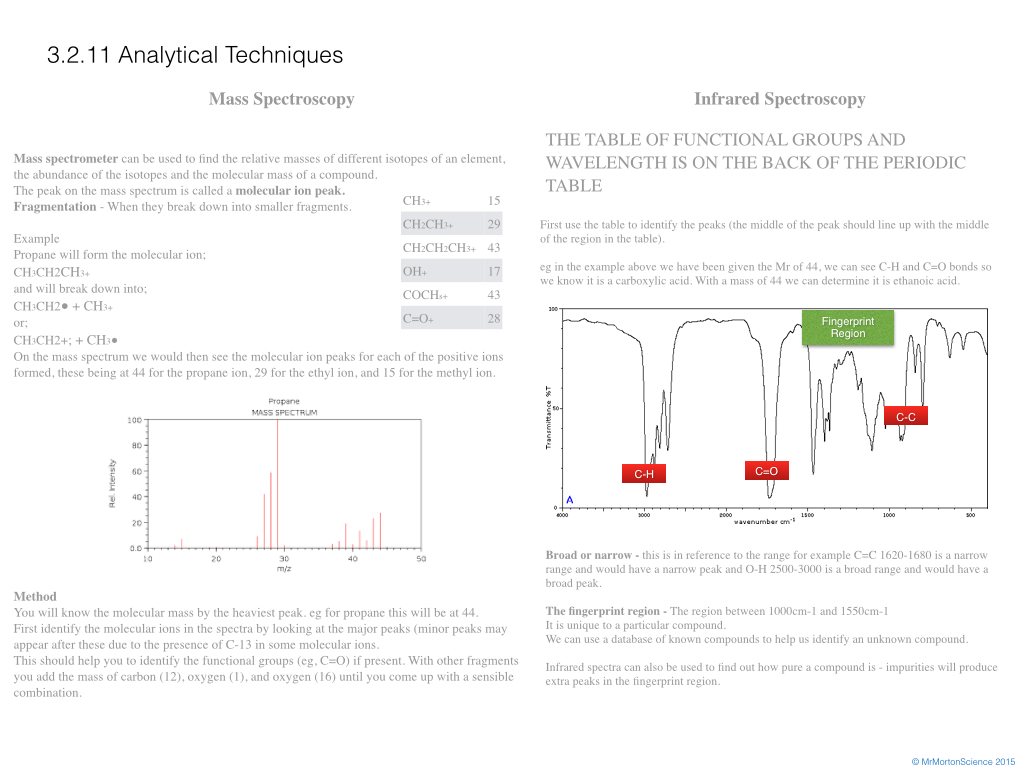
THE TABLE OF FUNCTIONAL GROUPS AND WAVELENGTH IS ON THE BACK OF THE PERIODIC TABLE
The infra red spectra produces an inverse graph showing ‘peaks’ where the IR radiation is absorbed - showing which bonds are present.
The fingerprint region
The region between 1000cm-1 and 1550cm-1 is called the fingerprint region.
This is because it is unique to a particular compound.
We can use a database of known compounds to help us identify an unknown compound (just like with fingerprints).
Infrared spectra can also be used to find out how pure a compound is - impurities will produce extra peaks in the fingerprint region.
Using Infrared spectra
First use the table to identify the peaks (the middle of the peak should line up with the middle of the region in the table).
You may be given the Mr (from mass spectra) which you can use to identify which molecule it is.
eg in the example above we have been given the Mr of 44, we can see C-H and C=O bonds so we know it is a carboxylic acid. With a mass of 44 we can determine it is ethanoic acid.
In Infrared (IR) spectroscopy, we pass a small beam of IR radiation through a sample.
When the IR hits the sample different frequencies of the IR radiation are absorbed by different bonds in the sample. (Different atoms also absorb different frequencies but in organic chemistry this isn't very useful because they all contain C, H and O atoms).
If the one is in different places they will also absorb differently e.g. the OH bond in an atom and the OH bond in a carboxylic acid.
THE TABLE OF FUNCTIONAL GROUPS AND WAVELENGTH IS ON THE BACK OF THE PERIODIC TABLE
The infra red spectra produces an inverse graph showing ‘peaks’ where the IR radiation is absorbed - showing which bonds are present.
The fingerprint region
The region between 1000cm-1 and 1550cm-1 is called the fingerprint region.
This is because it is unique to a particular compound.
We can use a database of known compounds to help us identify an unknown compound (just like with fingerprints).
Infrared spectra can also be used to find out how pure a compound is - impurities will produce extra peaks in the fingerprint region.
Using Infrared spectra
First use the table to identify the peaks (the middle of the peak should line up with the middle of the region in the table).
You may be given the Mr (from mass spectra) which you can use to identify which molecule it is.
eg in the example above we have been given the Mr of 44, we can see C-H and C=O bonds so we know it is a carboxylic acid. With a mass of 44 we can determine it is ethanoic acid.
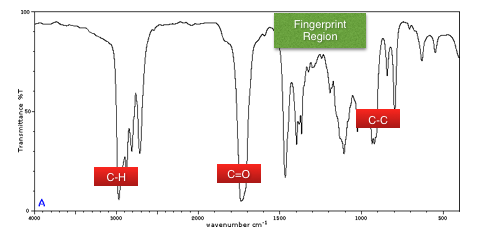
Some questions will refer to bands as being either broad or narrow - this is in reference to the range for example C=C 1620-1680 is a narrow range and would have a narrow peak and O-H 2500-3000 is a broad range and would have a broad peak.
|
| ||||
Energetics - Kinetics - Equilibria - Redox - Group VII - Group II - Metal Extraction - Haloalkanes - Alkenes - Alcohols - Analytical Tech... - Unit 1
